
Saturday, July 15, 2006
AMD64: java.lang.OutOfMemoryError
Today I discovered that AMD64 version of Sun Java VM 1.5.0 has some memory problems.
I spent last couple of weeks profiling a Java web application (running with Tomcat). The application crashed after running for 2-3 days with java.lang.OutOfMemoryError (even with heap size 4GB). My development machine is 32-bit and production machine 64-bit which confused me more as profiling was not able to find anything suspicious. Finally I tried using i586 JRE on our 64-bit production machines and things worked fine. Probably amd64 garbage collector has some bug. Lesson: Java HotSpot amd64 VM 1.5 has memory management problems! use 32-bit VM instead.
To reproduce this effect, I have following simple program:
#File: JavaMemoryProblems.java
import java.util.HashMap;
import java.util.Map;
public class JavaMemoryProblems {
   public static void main(String[] args) {
       Map<String, Integer> map = new HashMap<String, Integer>();
       int max = 1000000;
       for (int i=0; i<max; i++) {
           map.put("key"+i, new Integer(i));
       }
       System.out.println("Finished with a map of size "+map.size());
   }
}
When I run this program with i586 and amd64 versions of Java VM 1.5.0_07, I get the following results:
- 32-bit: java -Xmx120m JavaMemoryProblems. With 120MB memory it works fine.
- 64-bit: java -Xmx170m -XX:+UseSerialGC JavaMemoryProblems. Anything less than 180MB throws OutOfMemory (requires 50% more than i586 version).
- 64-bit: java -Xmx200m -XX:+UseParallelGC JavaMemoryProblems. With 200MB but with ParallelGC (default on server class machines) hangs and needs to be killed with kill -9. In this case the parallel GC thread keeps calling garbage collector repeatedly. Lesson: Use -XX:+UseSerialGC if running low on memory, ParallelGC takes too much time and CPU (and even hangs) before it figures out it can not continue.
After switching to i586 VM I am saving a lot of memory (30-40%). Earlier a simple search program required 250MB heap size to search a Lucene index with around 15 million docs (10GB index size), now it needs just 150MB. Maintaining statistics consisting of around 100 Tries each with roughly 1 million entries required over 1050MB with amd64 VM, now I can do the same with 650MB. Memory required for parsing a simple 55MB XML from weblogs using JDOM with SAXBuilder with i586 VM is 290MB memory compared to 440MB for amd64. Similiar things are also mentioned by sotua in Ubuntu forums.
Anyway I have learned many interesting things about Java VM and garbage collection in last 2 weeks:
- Netbeans Profiler is better than Eclipse TPTP.
- Java debugging options -verbose:gc, -XX:+PrintGCDetails and -XX:+PrintGCTimestamps are really useful.
- Tuning GC with Java 5.0 is an interesting read.
- Difference between PermSize and HeapSize.

Tuesday, July 11, 2006
Profiling with Eclipse
This article explains setup required for profiling Java application (including tomcat) with eclipse using TPTP platform. I am using Linux with i386 Sun JDK 1.5.0 (it seems that 64-bit version of agent controller is not available). In order to use TPTP, one must install two things: agent controller and eclipse tptp plugin.
Agent Controller: Agent controller needs to be installed on machine where the java process will run.
1. Download the agent controller and unzip it.
mkdir $HOME/usr/tptp-agent
cd $HOME/usr/tptp-agent/
unzip tptpdc.linux_ia32-TPTP-4.2.0.zip
2. Set up the environment variables by adding the following in your .bashrc after adjusting the JAVA_HOME
export JAVA_HOME=/opt/java/jdk1.5.0_06/
export RASERVER_HOME=$HOME/usr/tptp-agent/
export LD_LIBRARY_PATH=$RASERVER_HOME/lib/:$LD_LIBRARY_PATH:$JAVA_HOME/jre/lib/i386/server/
export PATH=$JAVA_HOME/bin/:$PATH:$RASERVER_HOME/bin/
3. Configure the agent controller by running the setup script from bin directory. When asked for network configuration, provide a list of allowed hosts or allow everyone.
cd $HOME/usr/tptp-agent/bin/
./SetConfig.sh
4. Edit RAStart.sh script in bin directory to point to correct RASERVER_HOME
5. Start agent controller using the command RAStart.sh. To stop use RAStop.sh.
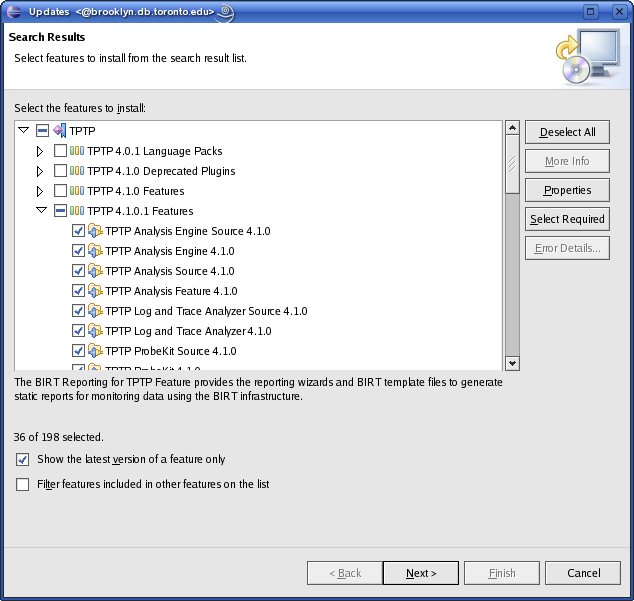
TPTP Eclipse Plugin: First check requirements for installing TPTP. Atleast JDK 1.4, Eclipse 3.2 and EMF are required. Update manager can be used to install TPTP using remote URL http://eclipse.org/tptp/updates/site.xml. If you don't have BIRT installed (which is an optional requirement), unselect features needing BIRT. On successful completion of installation, Profiling and Logging will show up in list of available perspectives.

Start Profiling: After starting the agent controller, start the long running Java process to profile with extra argument -XrunpiAgent:server=enabled.
java -XrunpiAgent:server=enabled MyJavaProgram
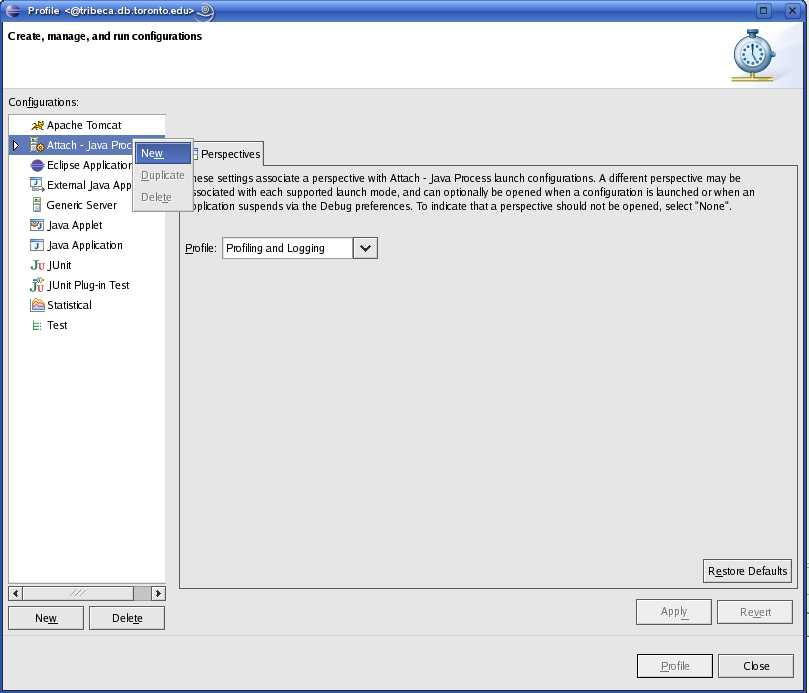
For profiling Tomcat, add this in catalina.sh under JAVA_OPTS. Start eclipse, select profile from toolbar -> Attach to Java process. Specify the host in the Host tab and select the process to profile in the Agents tab. From the Profiling tab select profiling type and click on Profile to start.

|

|
There are a bunch of profiling views available. Refer to eclipse tptp documentation for more help.
![]()