
Tuesday, July 11, 2006
Profiling with Eclipse
This article explains setup required for profiling Java application (including tomcat) with eclipse using TPTP platform. I am using Linux with i386 Sun JDK 1.5.0 (it seems that 64-bit version of agent controller is not available). In order to use TPTP, one must install two things: agent controller and eclipse tptp plugin.
Agent Controller: Agent controller needs to be installed on machine where the java process will run.
1. Download the agent controller and unzip it.
mkdir $HOME/usr/tptp-agent
cd $HOME/usr/tptp-agent/
unzip tptpdc.linux_ia32-TPTP-4.2.0.zip
2. Set up the environment variables by adding the following in your .bashrc after adjusting the JAVA_HOME
export JAVA_HOME=/opt/java/jdk1.5.0_06/
export RASERVER_HOME=$HOME/usr/tptp-agent/
export LD_LIBRARY_PATH=$RASERVER_HOME/lib/:$LD_LIBRARY_PATH:$JAVA_HOME/jre/lib/i386/server/
export PATH=$JAVA_HOME/bin/:$PATH:$RASERVER_HOME/bin/
3. Configure the agent controller by running the setup script from bin directory. When asked for network configuration, provide a list of allowed hosts or allow everyone.
cd $HOME/usr/tptp-agent/bin/
./SetConfig.sh
4. Edit RAStart.sh script in bin directory to point to correct RASERVER_HOME
5. Start agent controller using the command RAStart.sh. To stop use RAStop.sh.
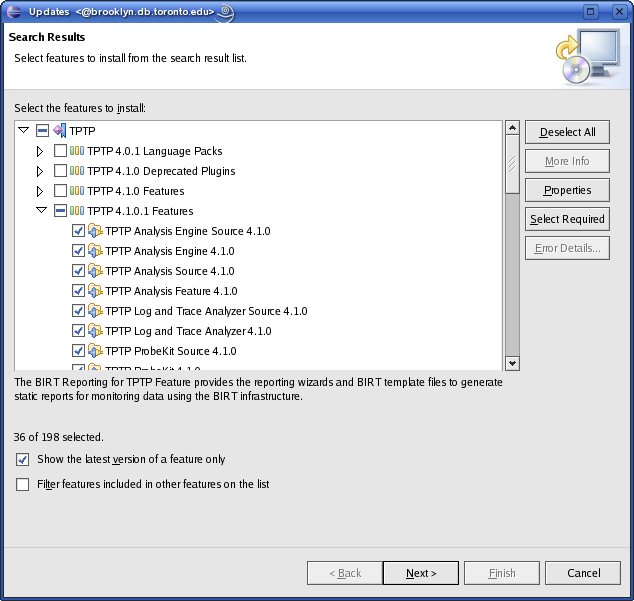
TPTP Eclipse Plugin: First check requirements for installing TPTP. Atleast JDK 1.4, Eclipse 3.2 and EMF are required. Update manager can be used to install TPTP using remote URL http://eclipse.org/tptp/updates/site.xml. If you don't have BIRT installed (which is an optional requirement), unselect features needing BIRT. On successful completion of installation, Profiling and Logging will show up in list of available perspectives.

Start Profiling: After starting the agent controller, start the long running Java process to profile with extra argument -XrunpiAgent:server=enabled.
java -XrunpiAgent:server=enabled MyJavaProgram
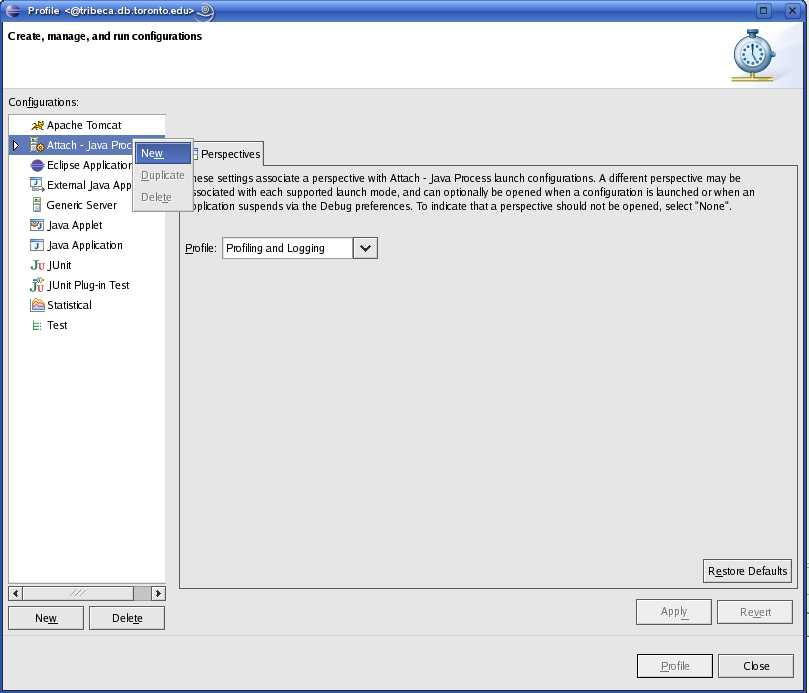
For profiling Tomcat, add this in catalina.sh under JAVA_OPTS. Start eclipse, select profile from toolbar -> Attach to Java process. Specify the host in the Host tab and select the process to profile in the Agents tab. From the Profiling tab select profiling type and click on Profile to start.

|

|
There are a bunch of profiling views available. Refer to eclipse tptp documentation for more help.
 -
-

<< Home
![]()